Uma Klein · 5 September 2026
How Neighborhood Feedback Loops Shape Urban Policy Through Digital Platforms
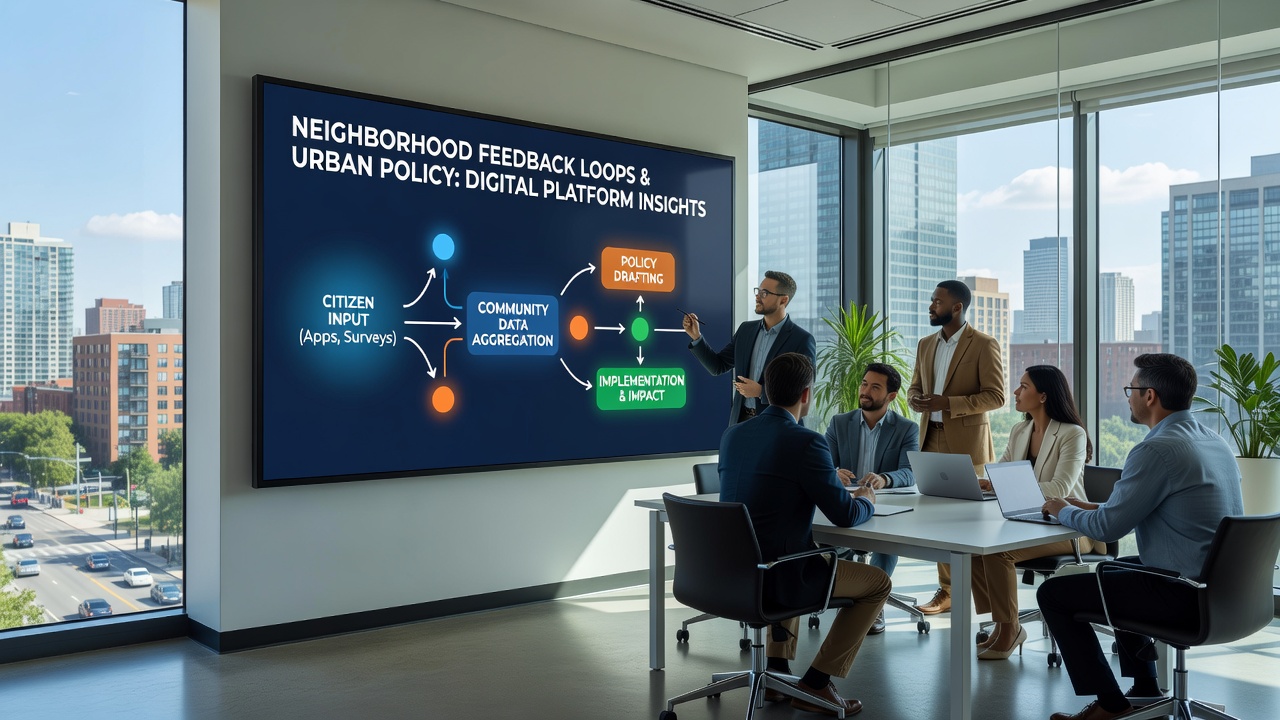
Digital platforms have created structured channels where residents submit observations about local conditions, and those inputs aggregate into datasets that city agencies review when adjusting services and regulations. Researchers tracking platform usage across multiple metropolitan areas note that feedback volumes often correlate with subsequent budget allocations for street repairs, park maintenance, and public transit adjustments.
Platform Mechanisms and Data Collection
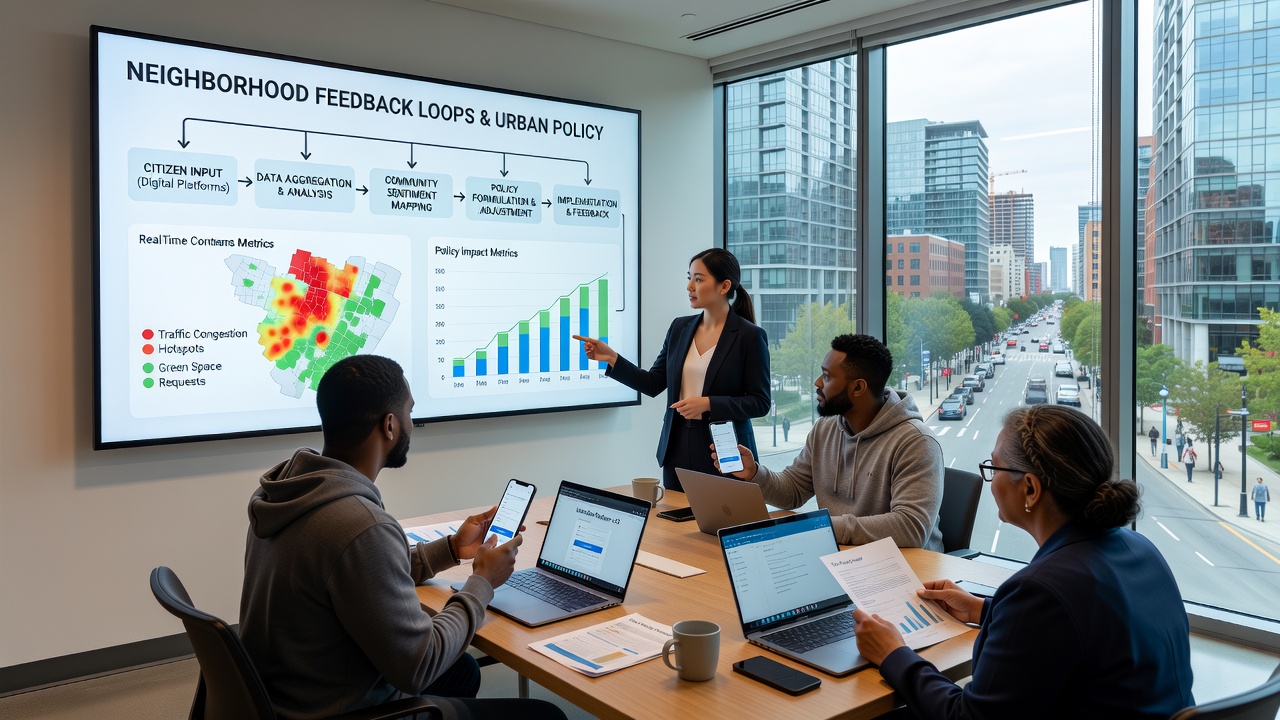
Applications such as SeeClickFix and city-specific portals allow users to geolocate issues like potholes, overgrown lots, or inadequate lighting, then route those reports directly to municipal work orders. The systems timestamp submissions and track resolution times, generating performance metrics that departments use to evaluate staffing needs. In several North American cities, officials have integrated these datasets with existing GIS layers so analysts can identify clusters where repeated complaints indicate systemic infrastructure shortfalls rather than isolated incidents.
European municipalities have adopted similar tools through the European Digital Innovation Hubs network, where standardized APIs enable cross-border comparison of resident engagement patterns. Data from these systems shows that neighborhoods with higher smartphone penetration submit reports at rates up to three times those of areas with lower connectivity, prompting some administrations to deploy targeted outreach programs that include paper forms and community kiosks.
Policy Adjustments Driven by Aggregated Input
Urban planning offices in Canada began incorporating platform-derived heat maps into official zoning reviews after 2024 pilot programs demonstrated that complaint density aligned with areas later prioritized for rezoning. Transport Canada reports indicate that cities using resident feedback platforms adjusted bus route frequencies in 28 percent of reviewed corridors between 2023 and 2025, with changes concentrated in districts showing elevated reports of overcrowding during peak hours.
September 2026 marks the scheduled release of updated smart-city guidelines from the OECD that explicitly reference neighborhood feedback datasets as a required input for sustainable urban development assessments. These guidelines encourage member countries to publish anonymized summaries of platform activity alongside traditional census figures, creating a more granular view of daily lived experience within census tracts.
Case Studies from Varied Regions
One study conducted by researchers at the University of Melbourne examined how the City of Melbourne's "Participate Melbourne" portal influenced decisions on public space redesign between 2022 and 2025. The analysis found that areas generating more than 150 reports per quarter received new seating and lighting installations 40 percent faster than comparable zones with lower submission rates. Officials attributed the difference to clearer documentation of usage patterns that justified capital expenditures during annual budget cycles.
In the United States, the Department of Housing and Urban Development has referenced platform data in notices about community development block grant allocations. Cities submitting supplemental reports drawn from resident apps have documented faster disbursement of funds for blight remediation projects, because the applications provide verifiable timestamps and photographic evidence that align with federal reporting requirements.
Integration with Existing Governance Structures
Municipal councils in Australia have begun embedding platform dashboards into regular committee meetings, where elected representatives review top-reported issues before voting on capital works programs. This practice emerged after state-level audits revealed that traditional complaint channels captured only a fraction of resident concerns, while digital systems surfaced previously undocumented patterns around pedestrian safety and waste collection timing.
Academic teams at several universities have developed natural language processing models that categorize free-text submissions into policy-relevant themes, allowing planners to quantify sentiment around proposed changes such as speed limit reductions or new bike lane placements. These models, tested on datasets from multiple continents, achieve classification accuracy above 85 percent according to peer-reviewed benchmarks published in urban informatics journals.
Conclusion
Neighborhood feedback platforms continue to supply structured datasets that city agencies incorporate into service planning and regulatory updates. As more administrations publish usage statistics and link them to policy outcomes, the relationship between resident submissions and municipal decisions becomes measurable across jurisdictions. Ongoing standardization efforts, including those scheduled for release in September 2026, aim to improve comparability while preserving local control over implementation.